
Xenoderma Age Prediction.
A GPU-accelerated machine learning ensemble pipeline that predicts the age of ocean organisms using non-invasive sensor data. MAE: 1.33.
The Problem
Taking tissue samples to determine the age of the rare Xenoderma species discovered in 2042 results in the organism's death. The goal is to accurately predict its age without any physical contact, relying solely on morphological and spectral sensor data.
Our Solution
A GPU-accelerated Ensemble pipeline consisting of LightGBM, XGBoost, and CatBoost models. High accuracy (MAE 1.33) was achieved by deriving 60+ new features and performing hyperparameter optimization with Optuna.
A comprehensive machine learning project predicting the age of Xenoderma species living on the ocean floor, using physical dimensions and spectral sensor data. Achieving a Mean Absolute Error (MAE) of 1.33 using a GPU-accelerated ensemble approach combining LightGBM, XGBoost, and CatBoost models. The pipeline includes 60+ engineered features extracted from 15,000 samples and hyperparameter tuning via Optuna.
Step-by-step Pipeline.
Exploratory Data Analysis (EDA)
Comprehensive analysis on 15,000 training and 10,000 test samples. Identified that the f7 sensor reading had the strongest correlation with the target variable (r=0.68) and verified the consistency between train/test datasets using adversarial validation (AUC ≈ 0.50).
Key Metrics
Stack
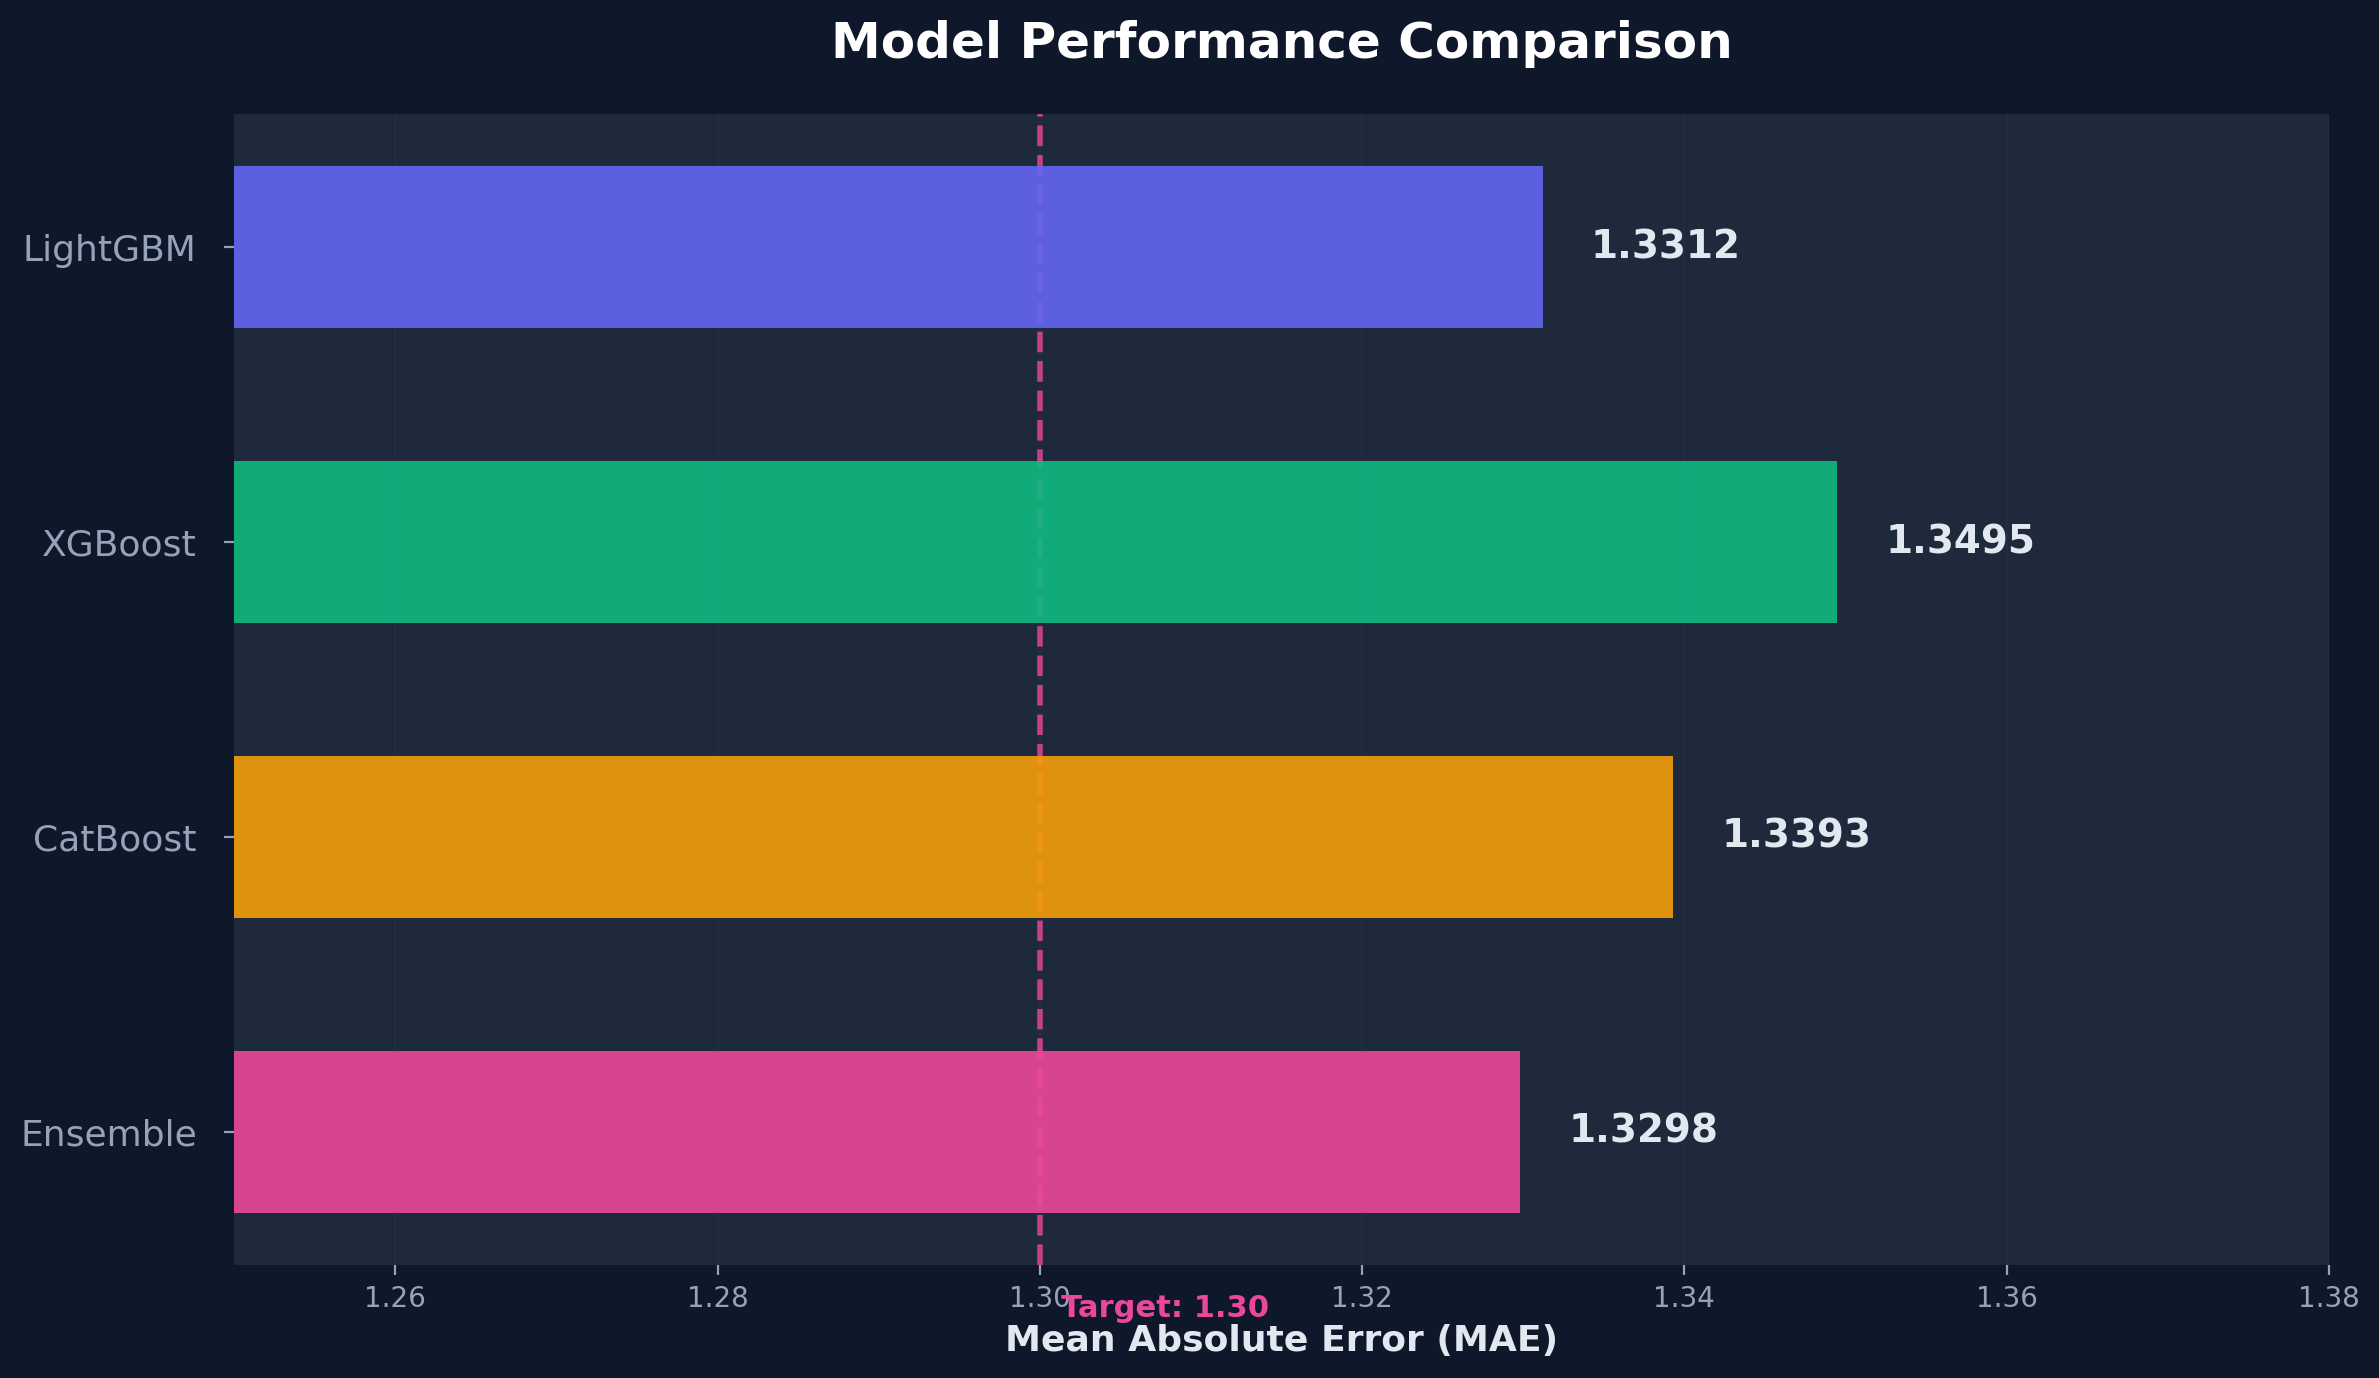
Model Performance Comparison
MAE performance comparison across different ML models.
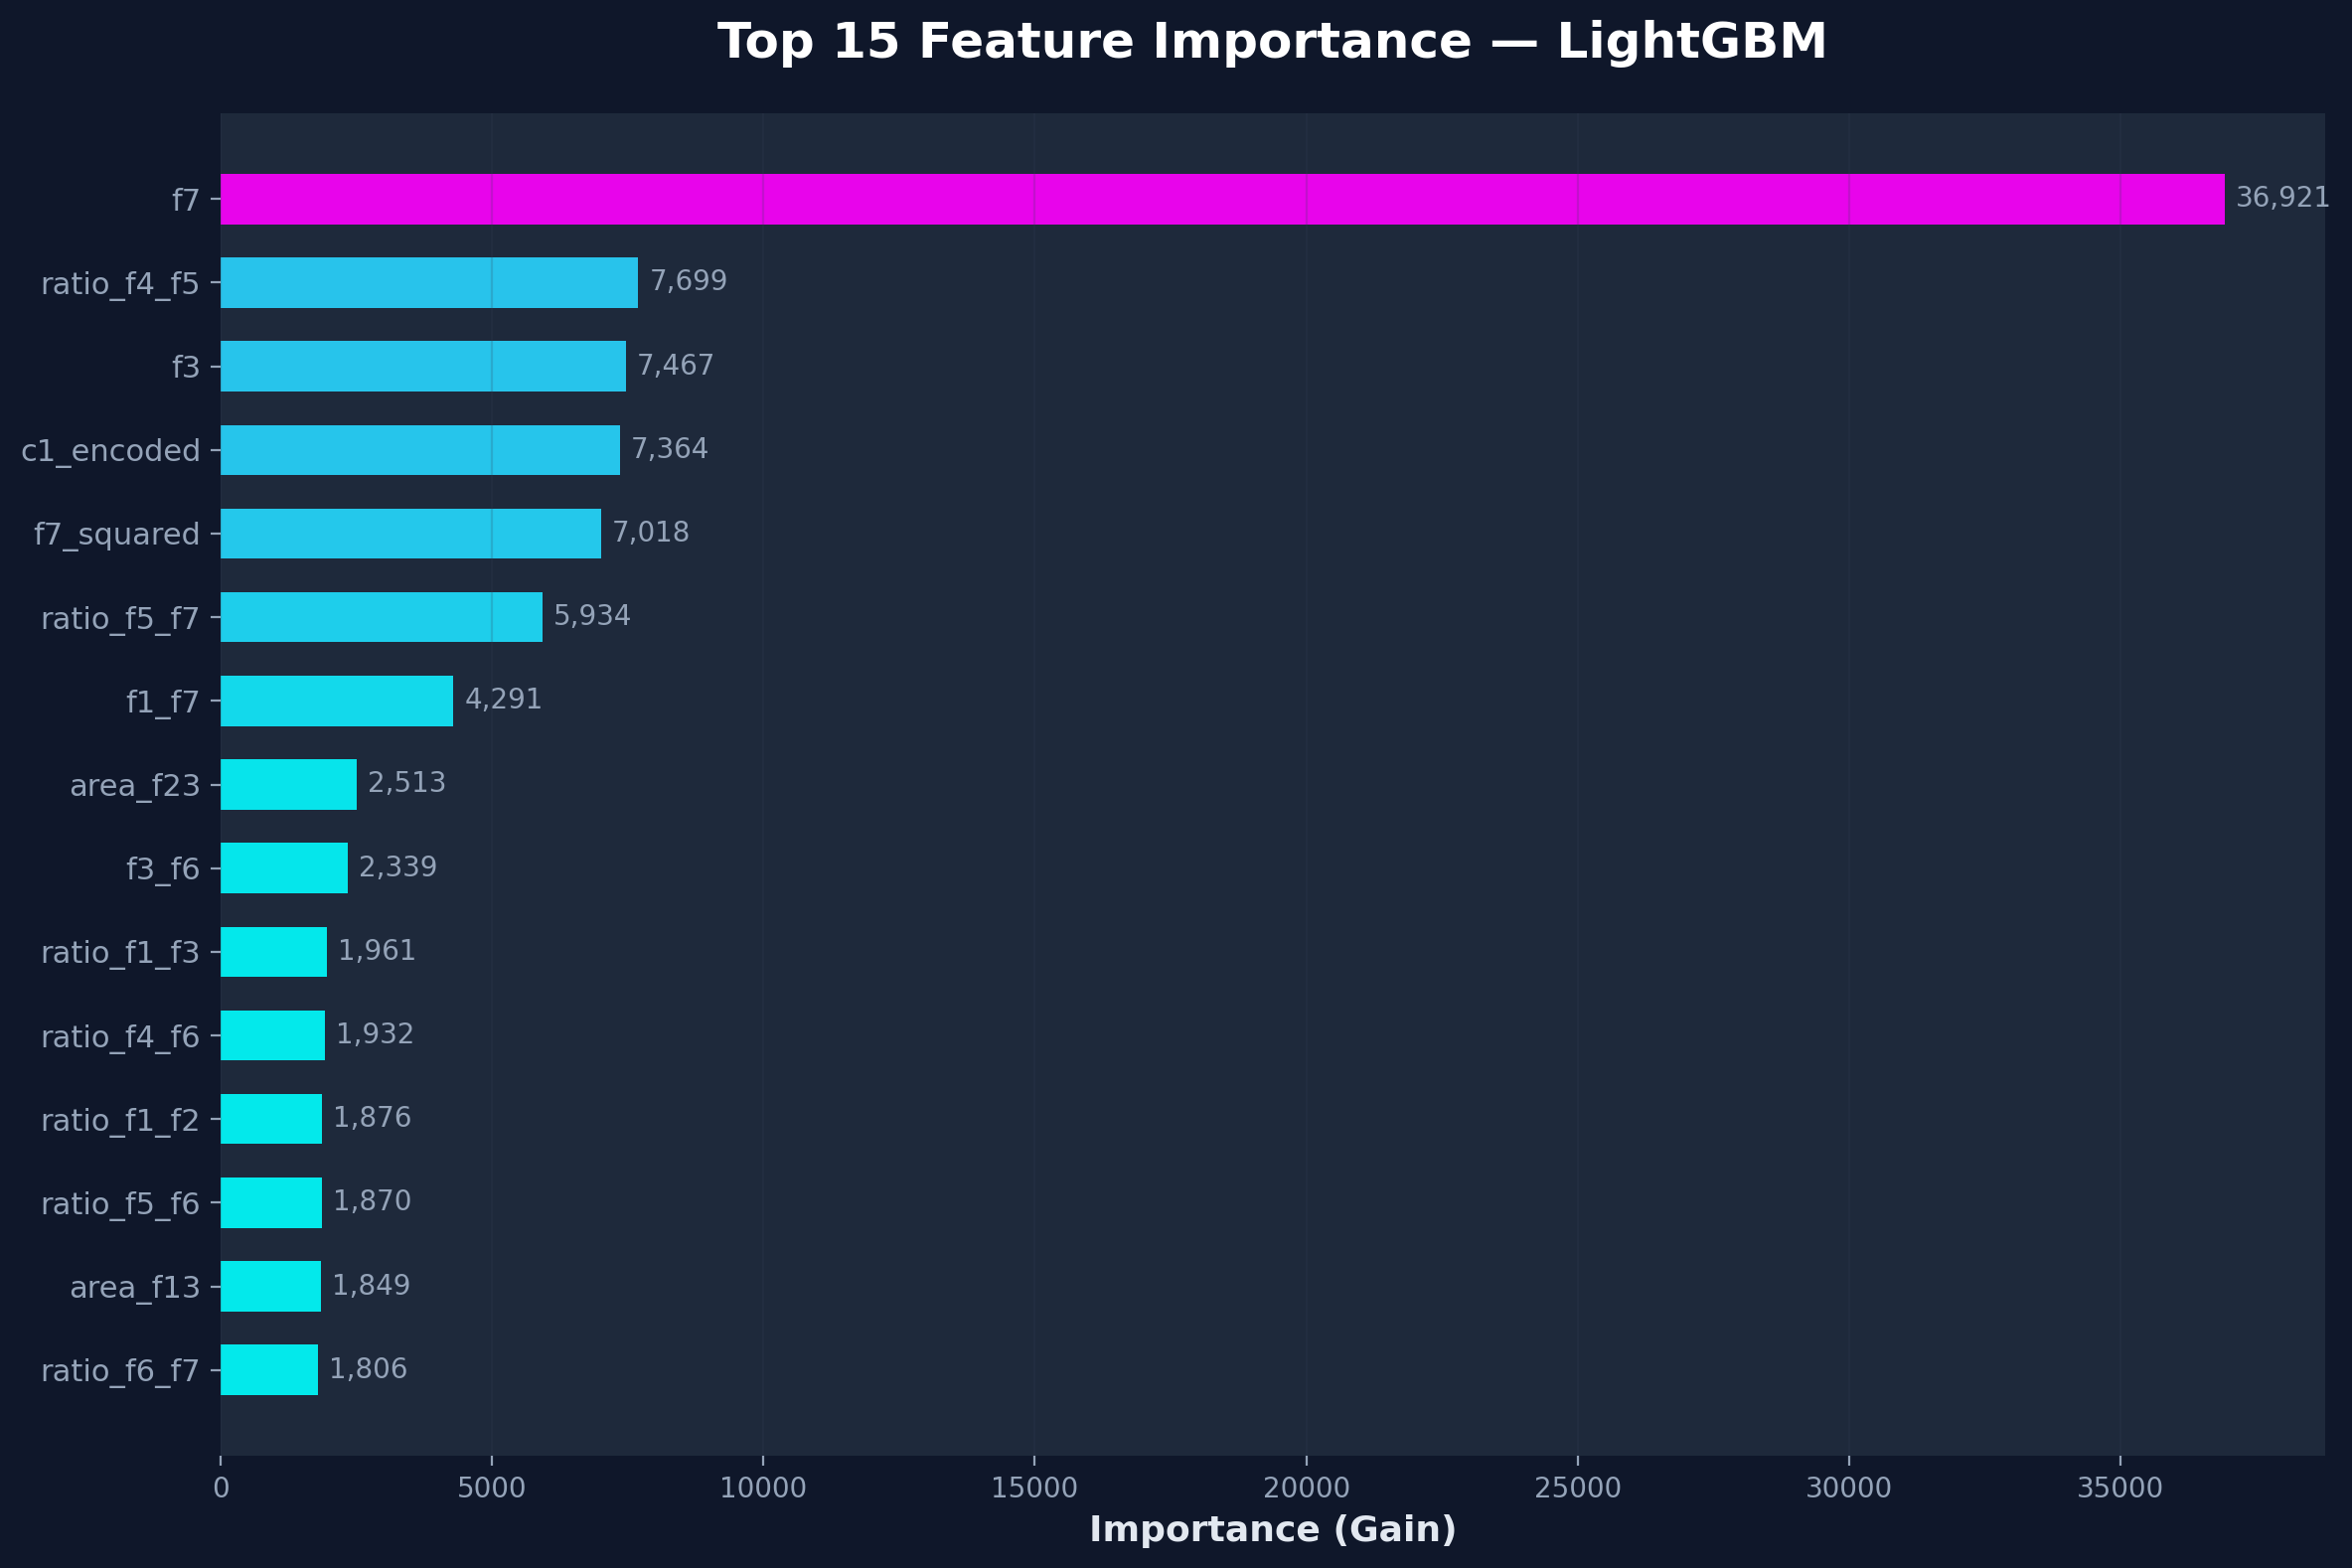
Top 15 Feature Importance
Shows the f7 sensor reading as the overwhelmingly most important feature.
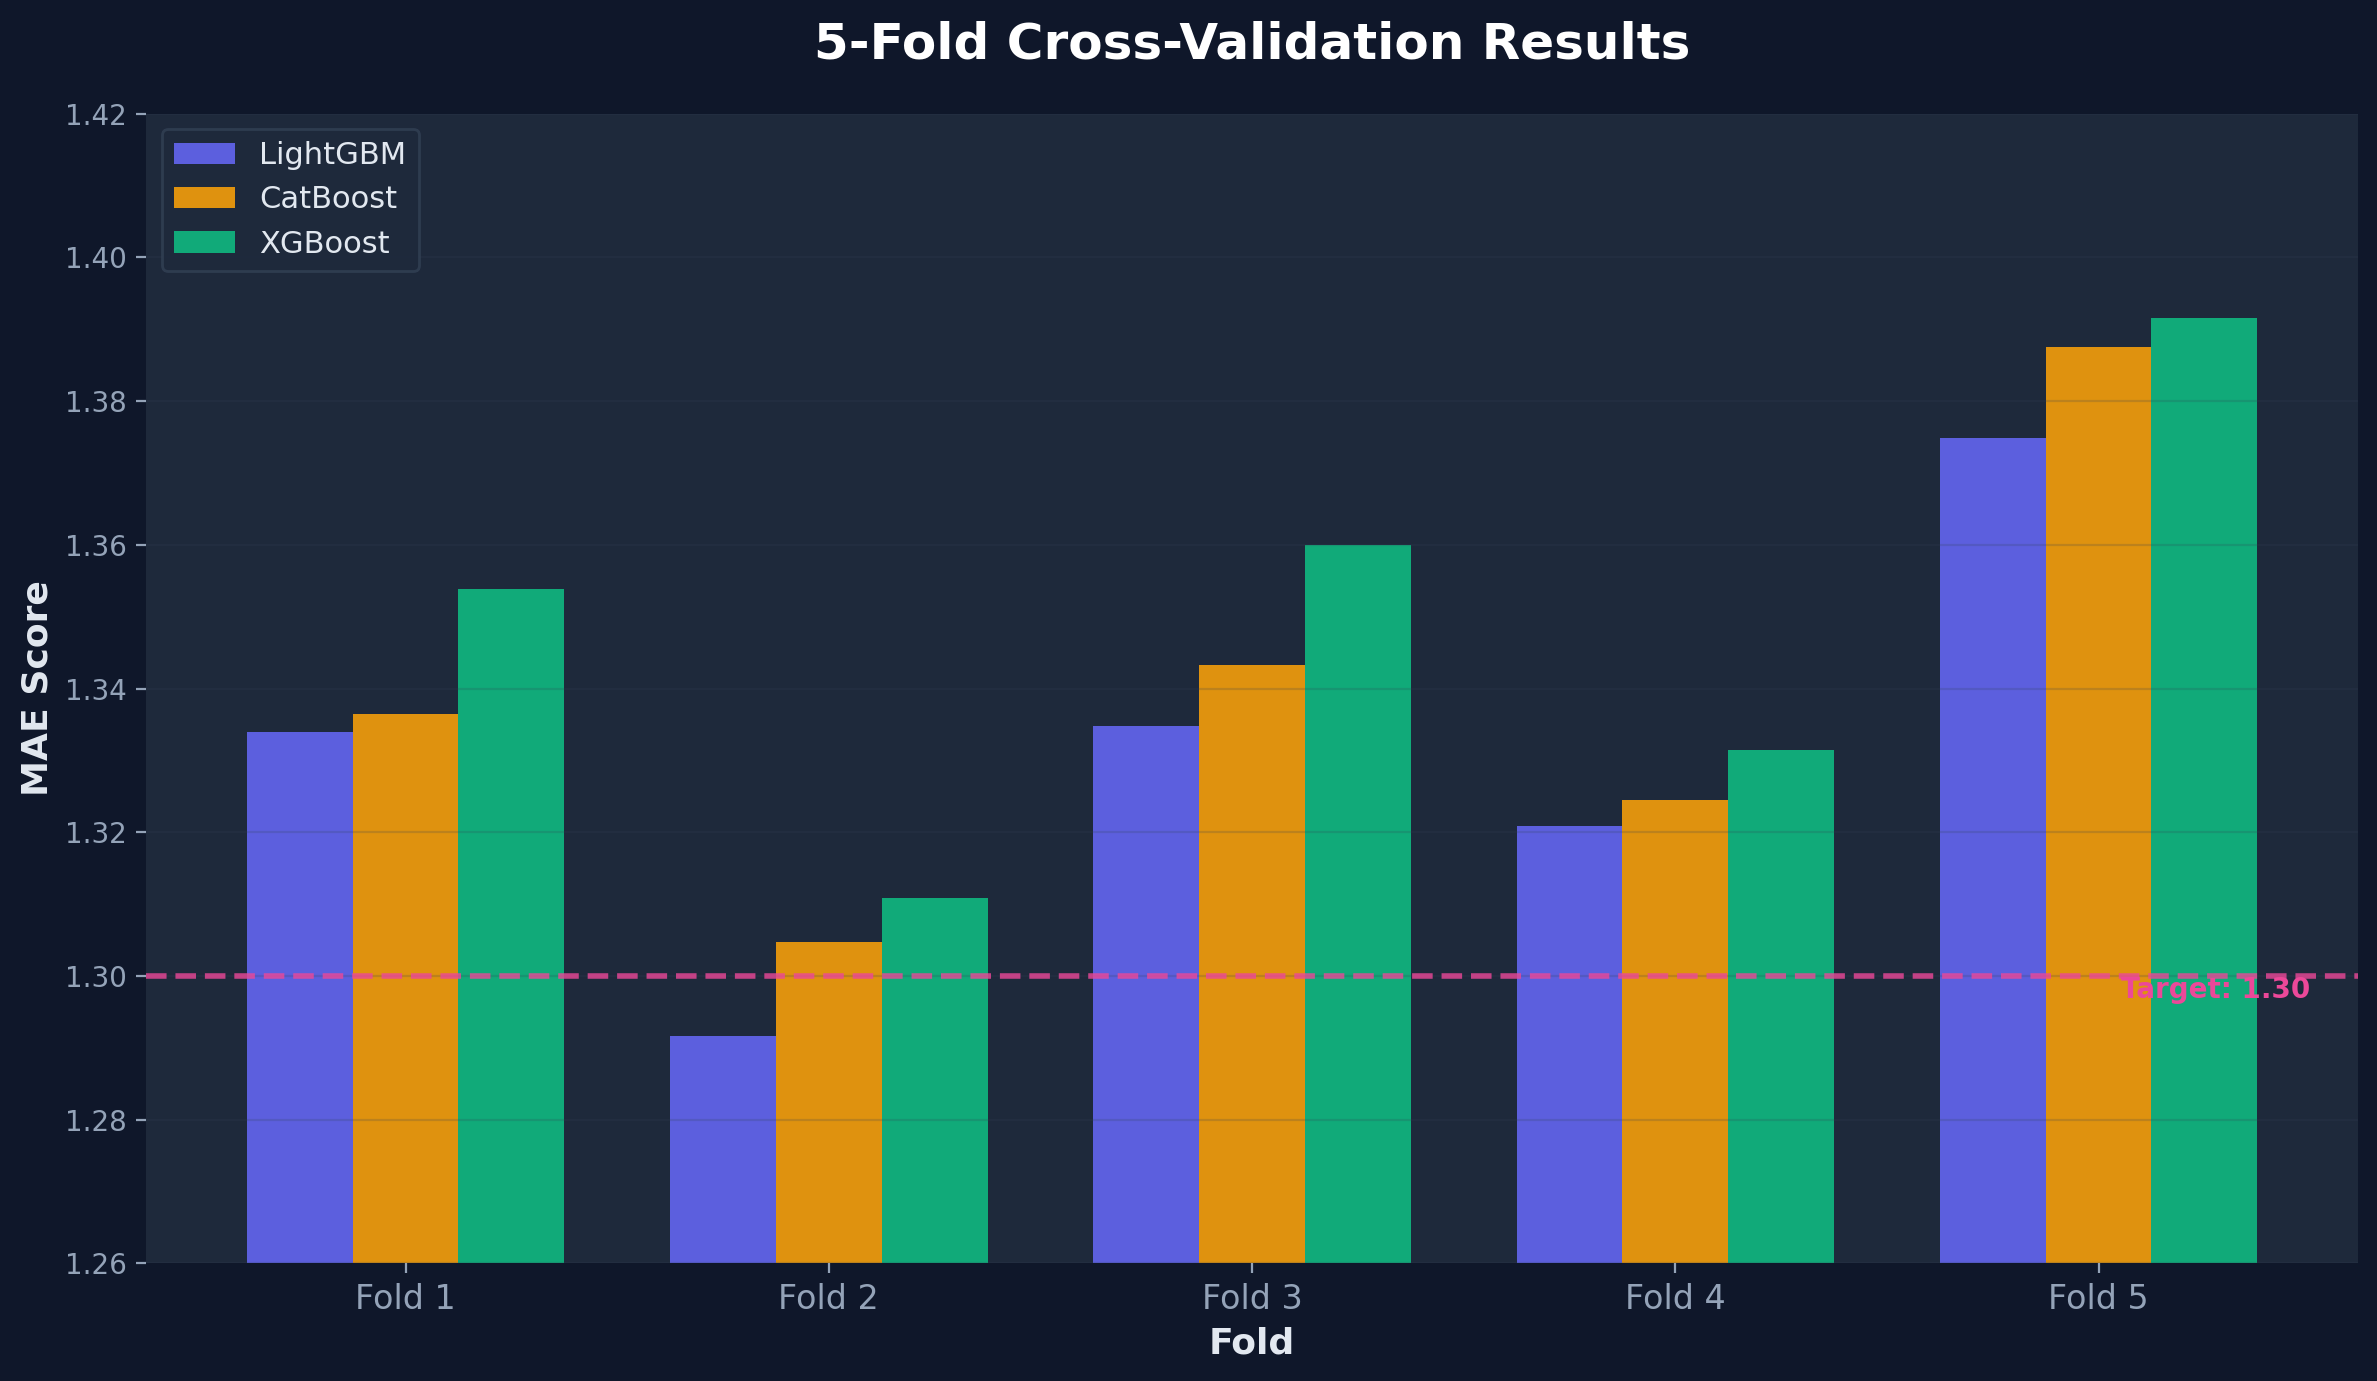
Cross-Validation Results
Fold-by-fold performance of models in 5-Fold CV.
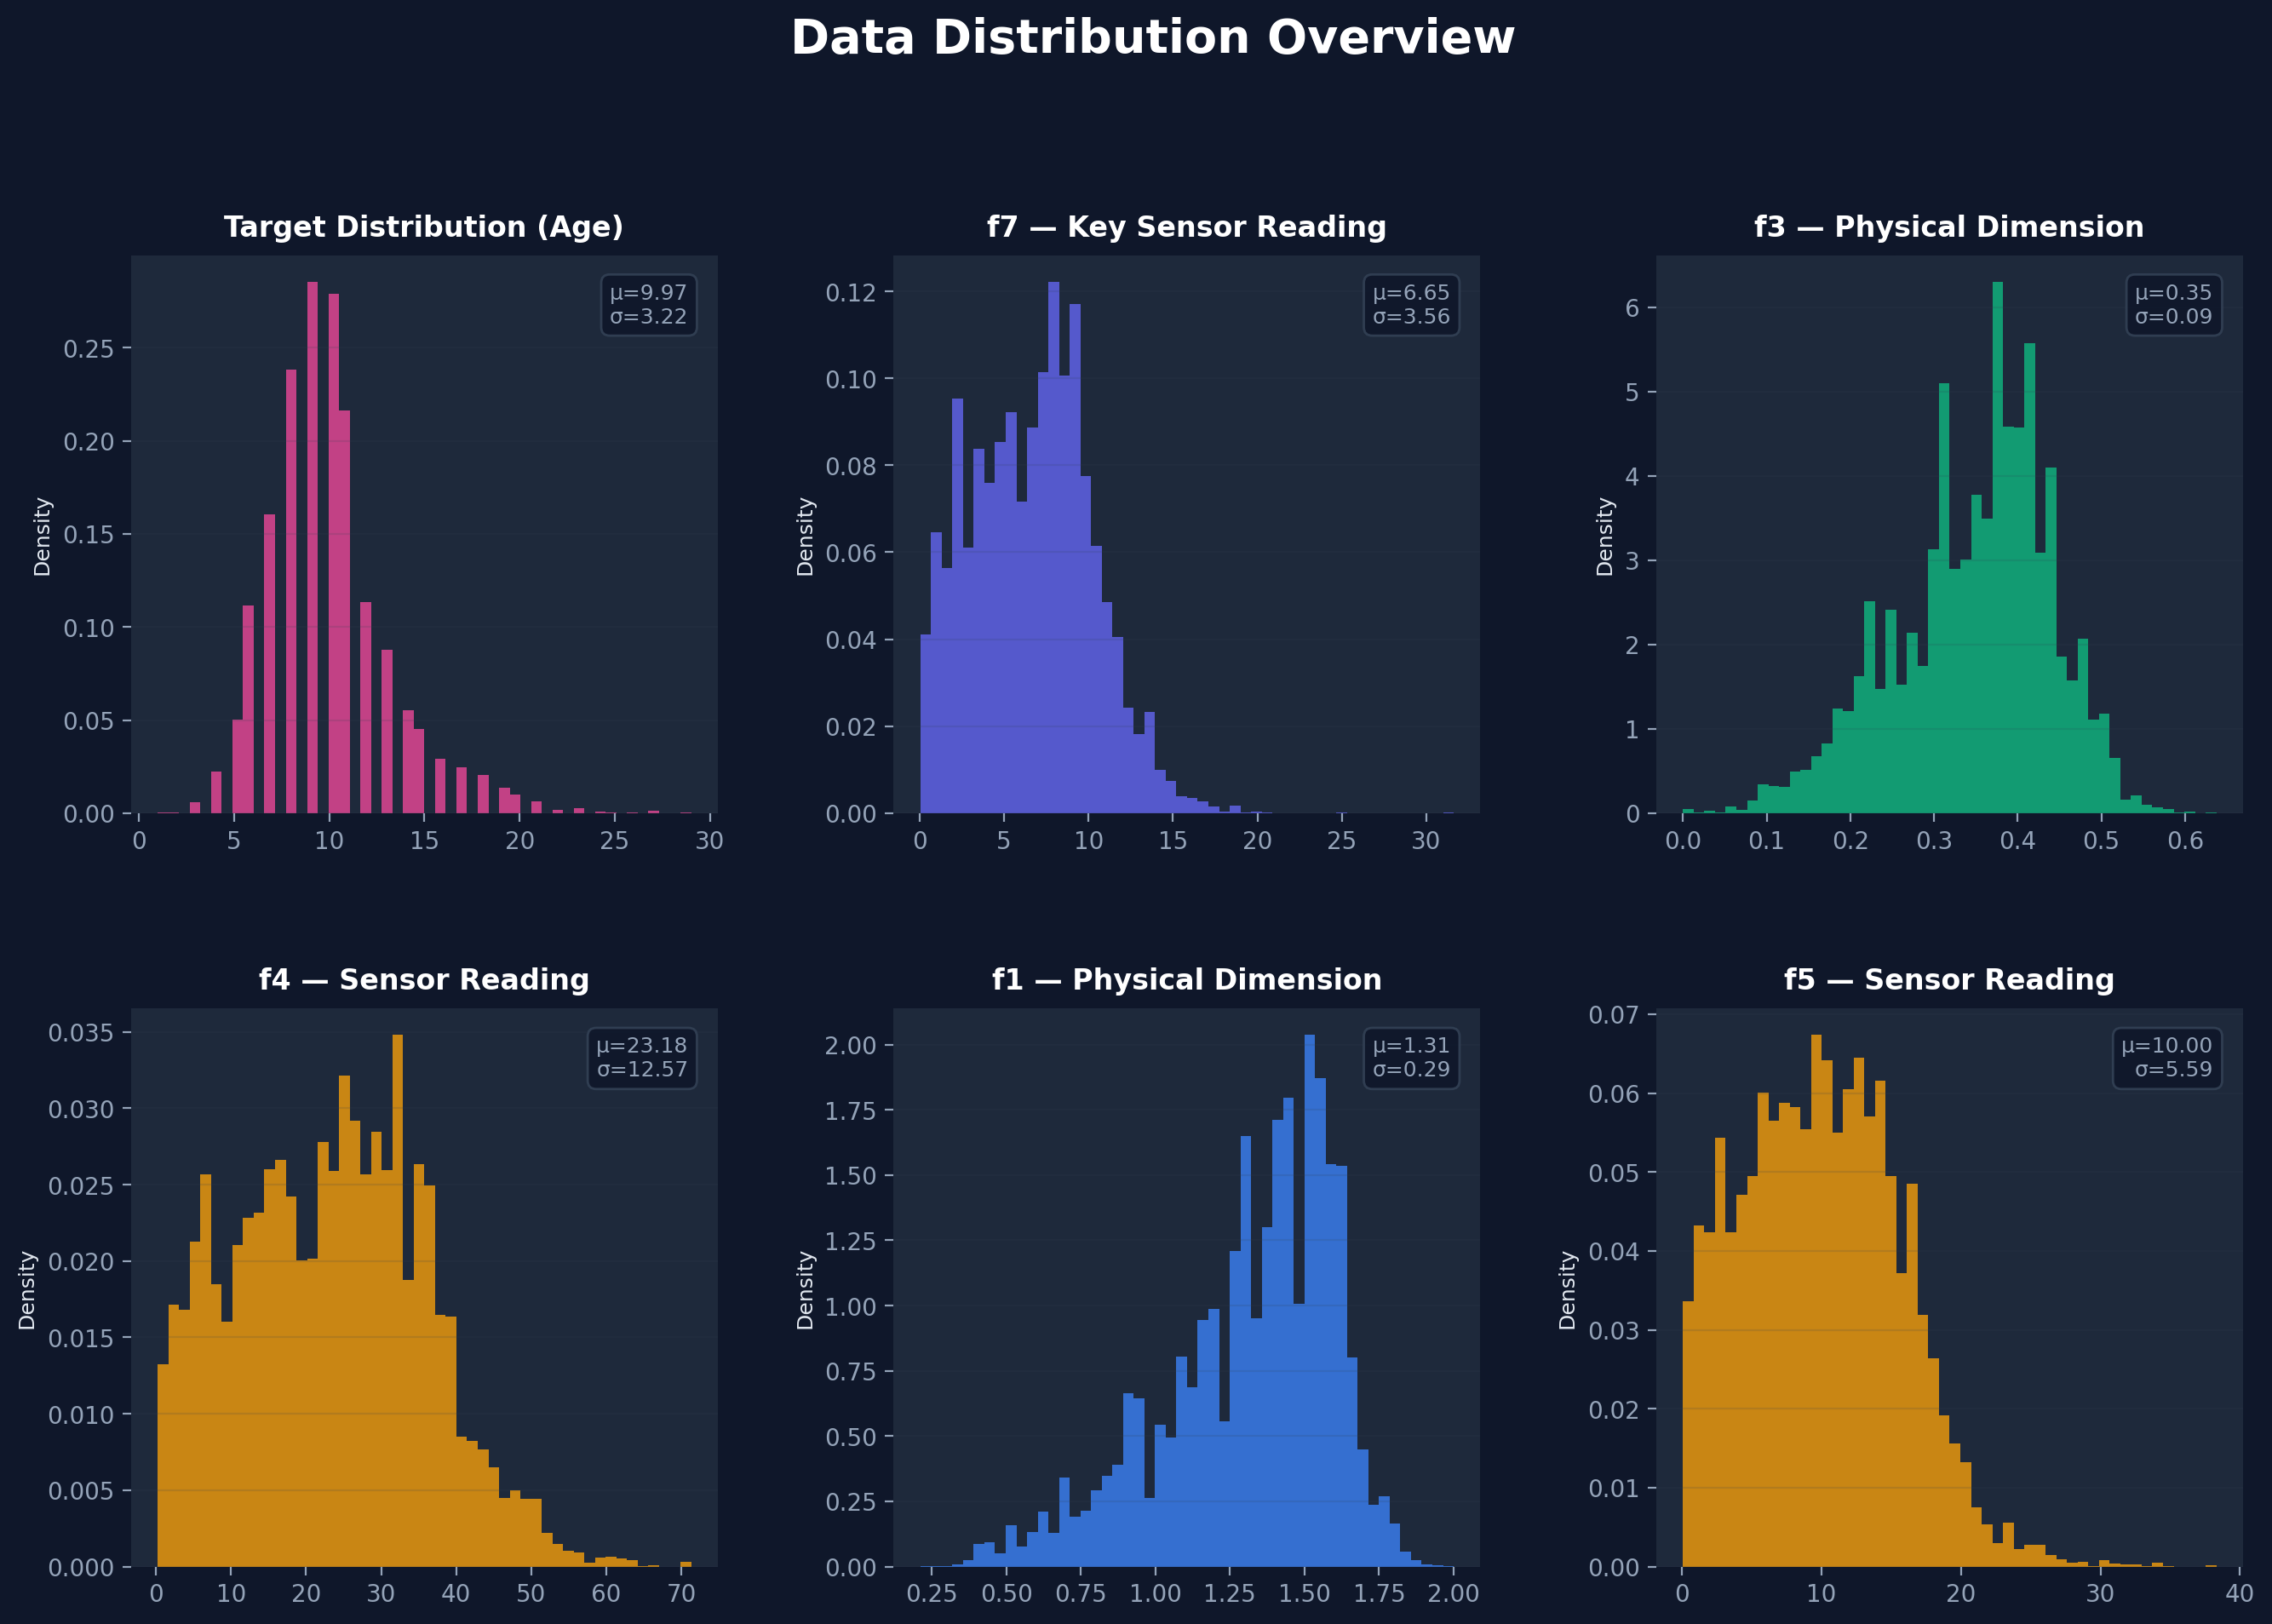
Data Distribution Overview
Distribution plots of the target variable (Age) and key features.
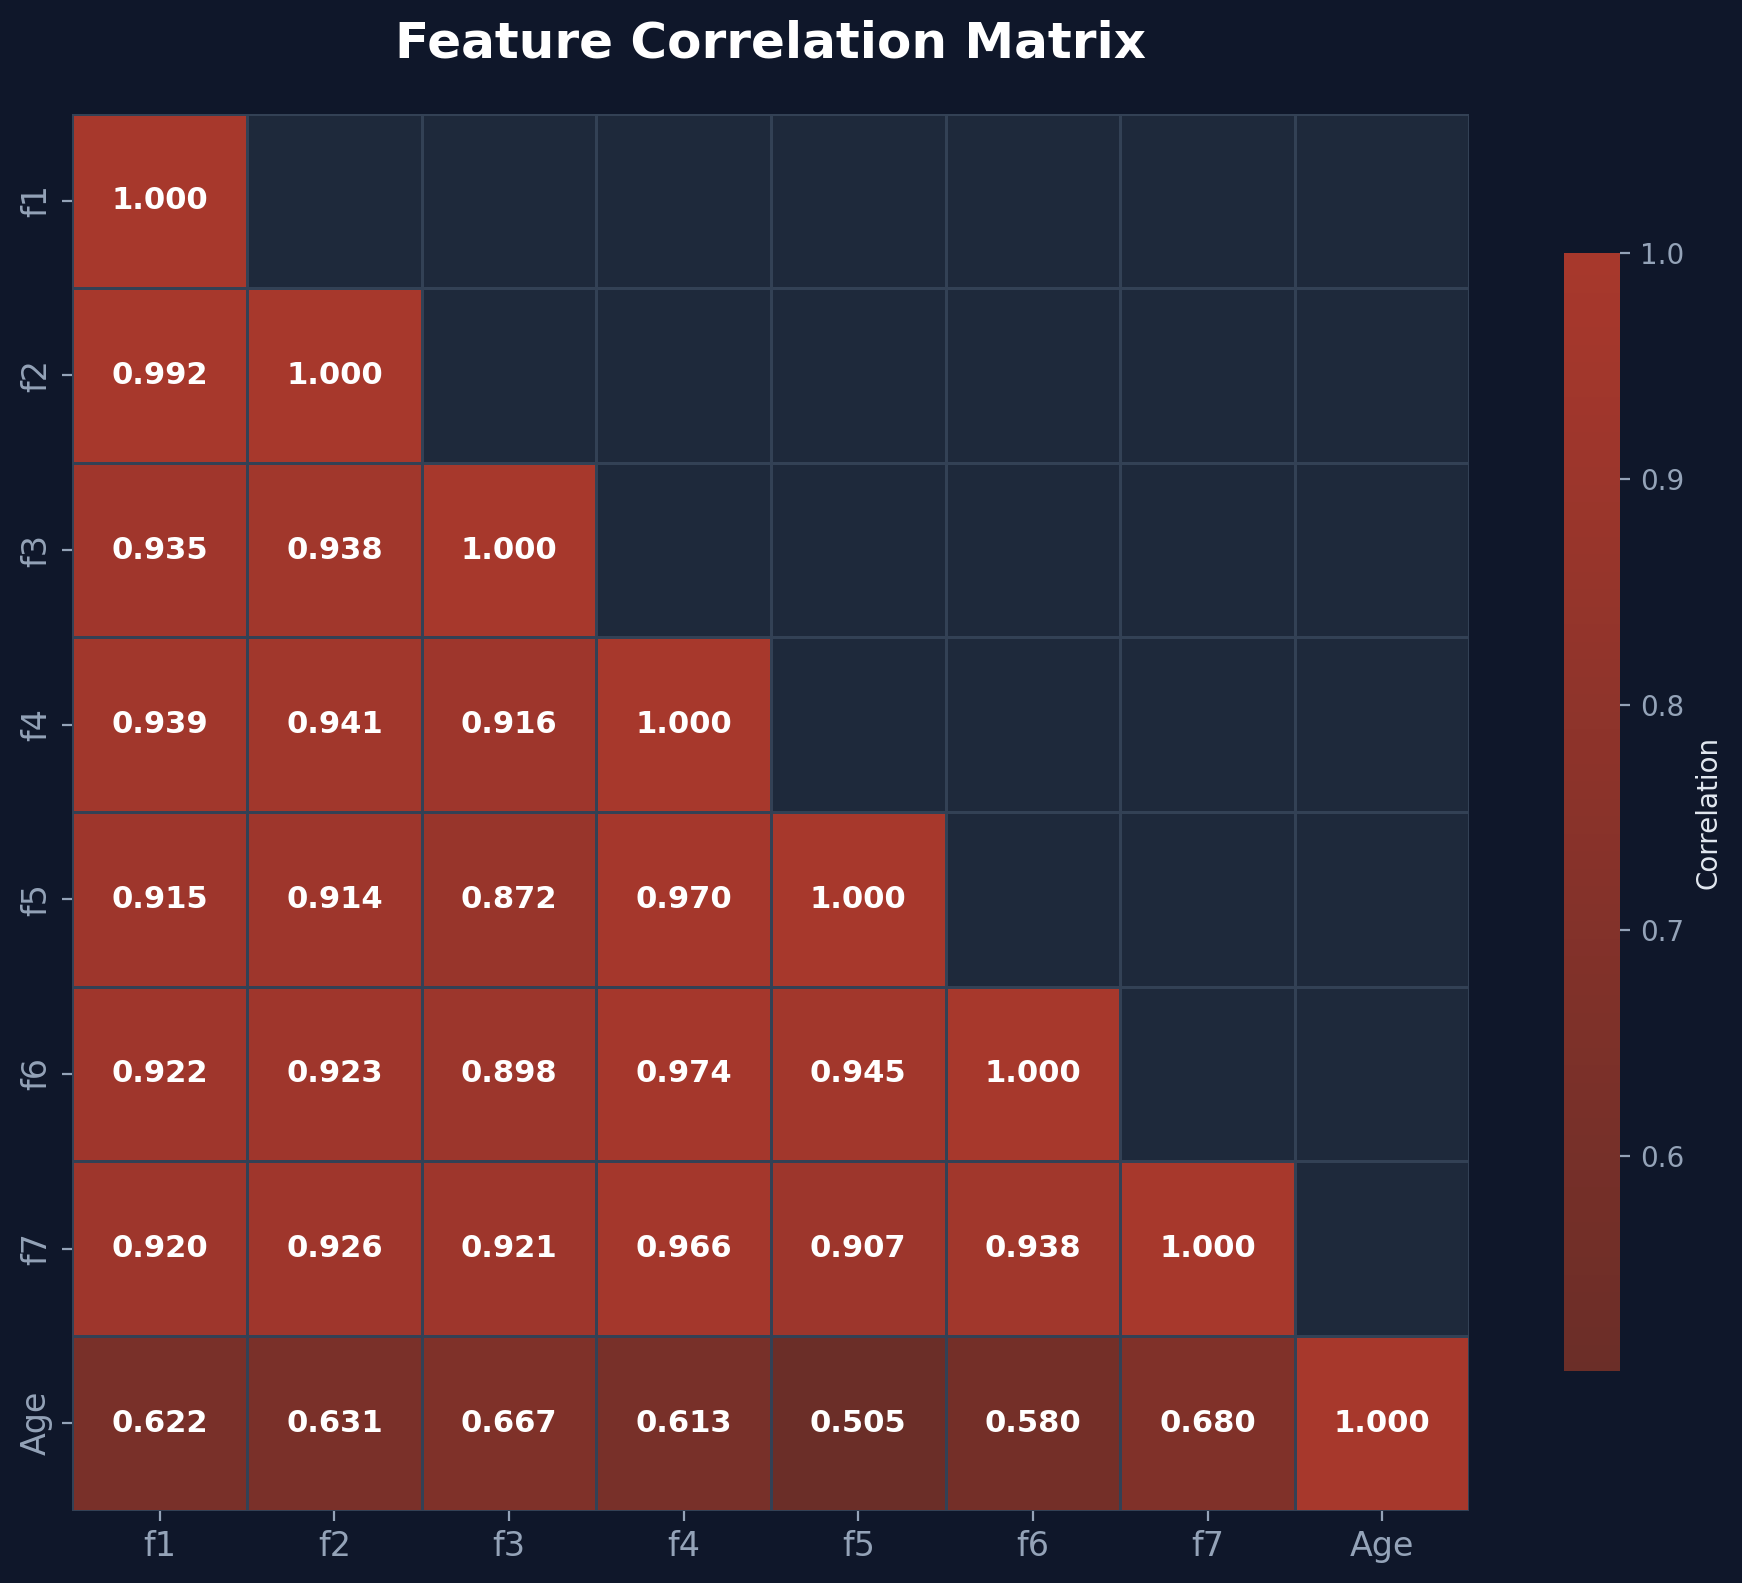
Feature Correlation Matrix
Multicollinearity among features and correlation heat map.
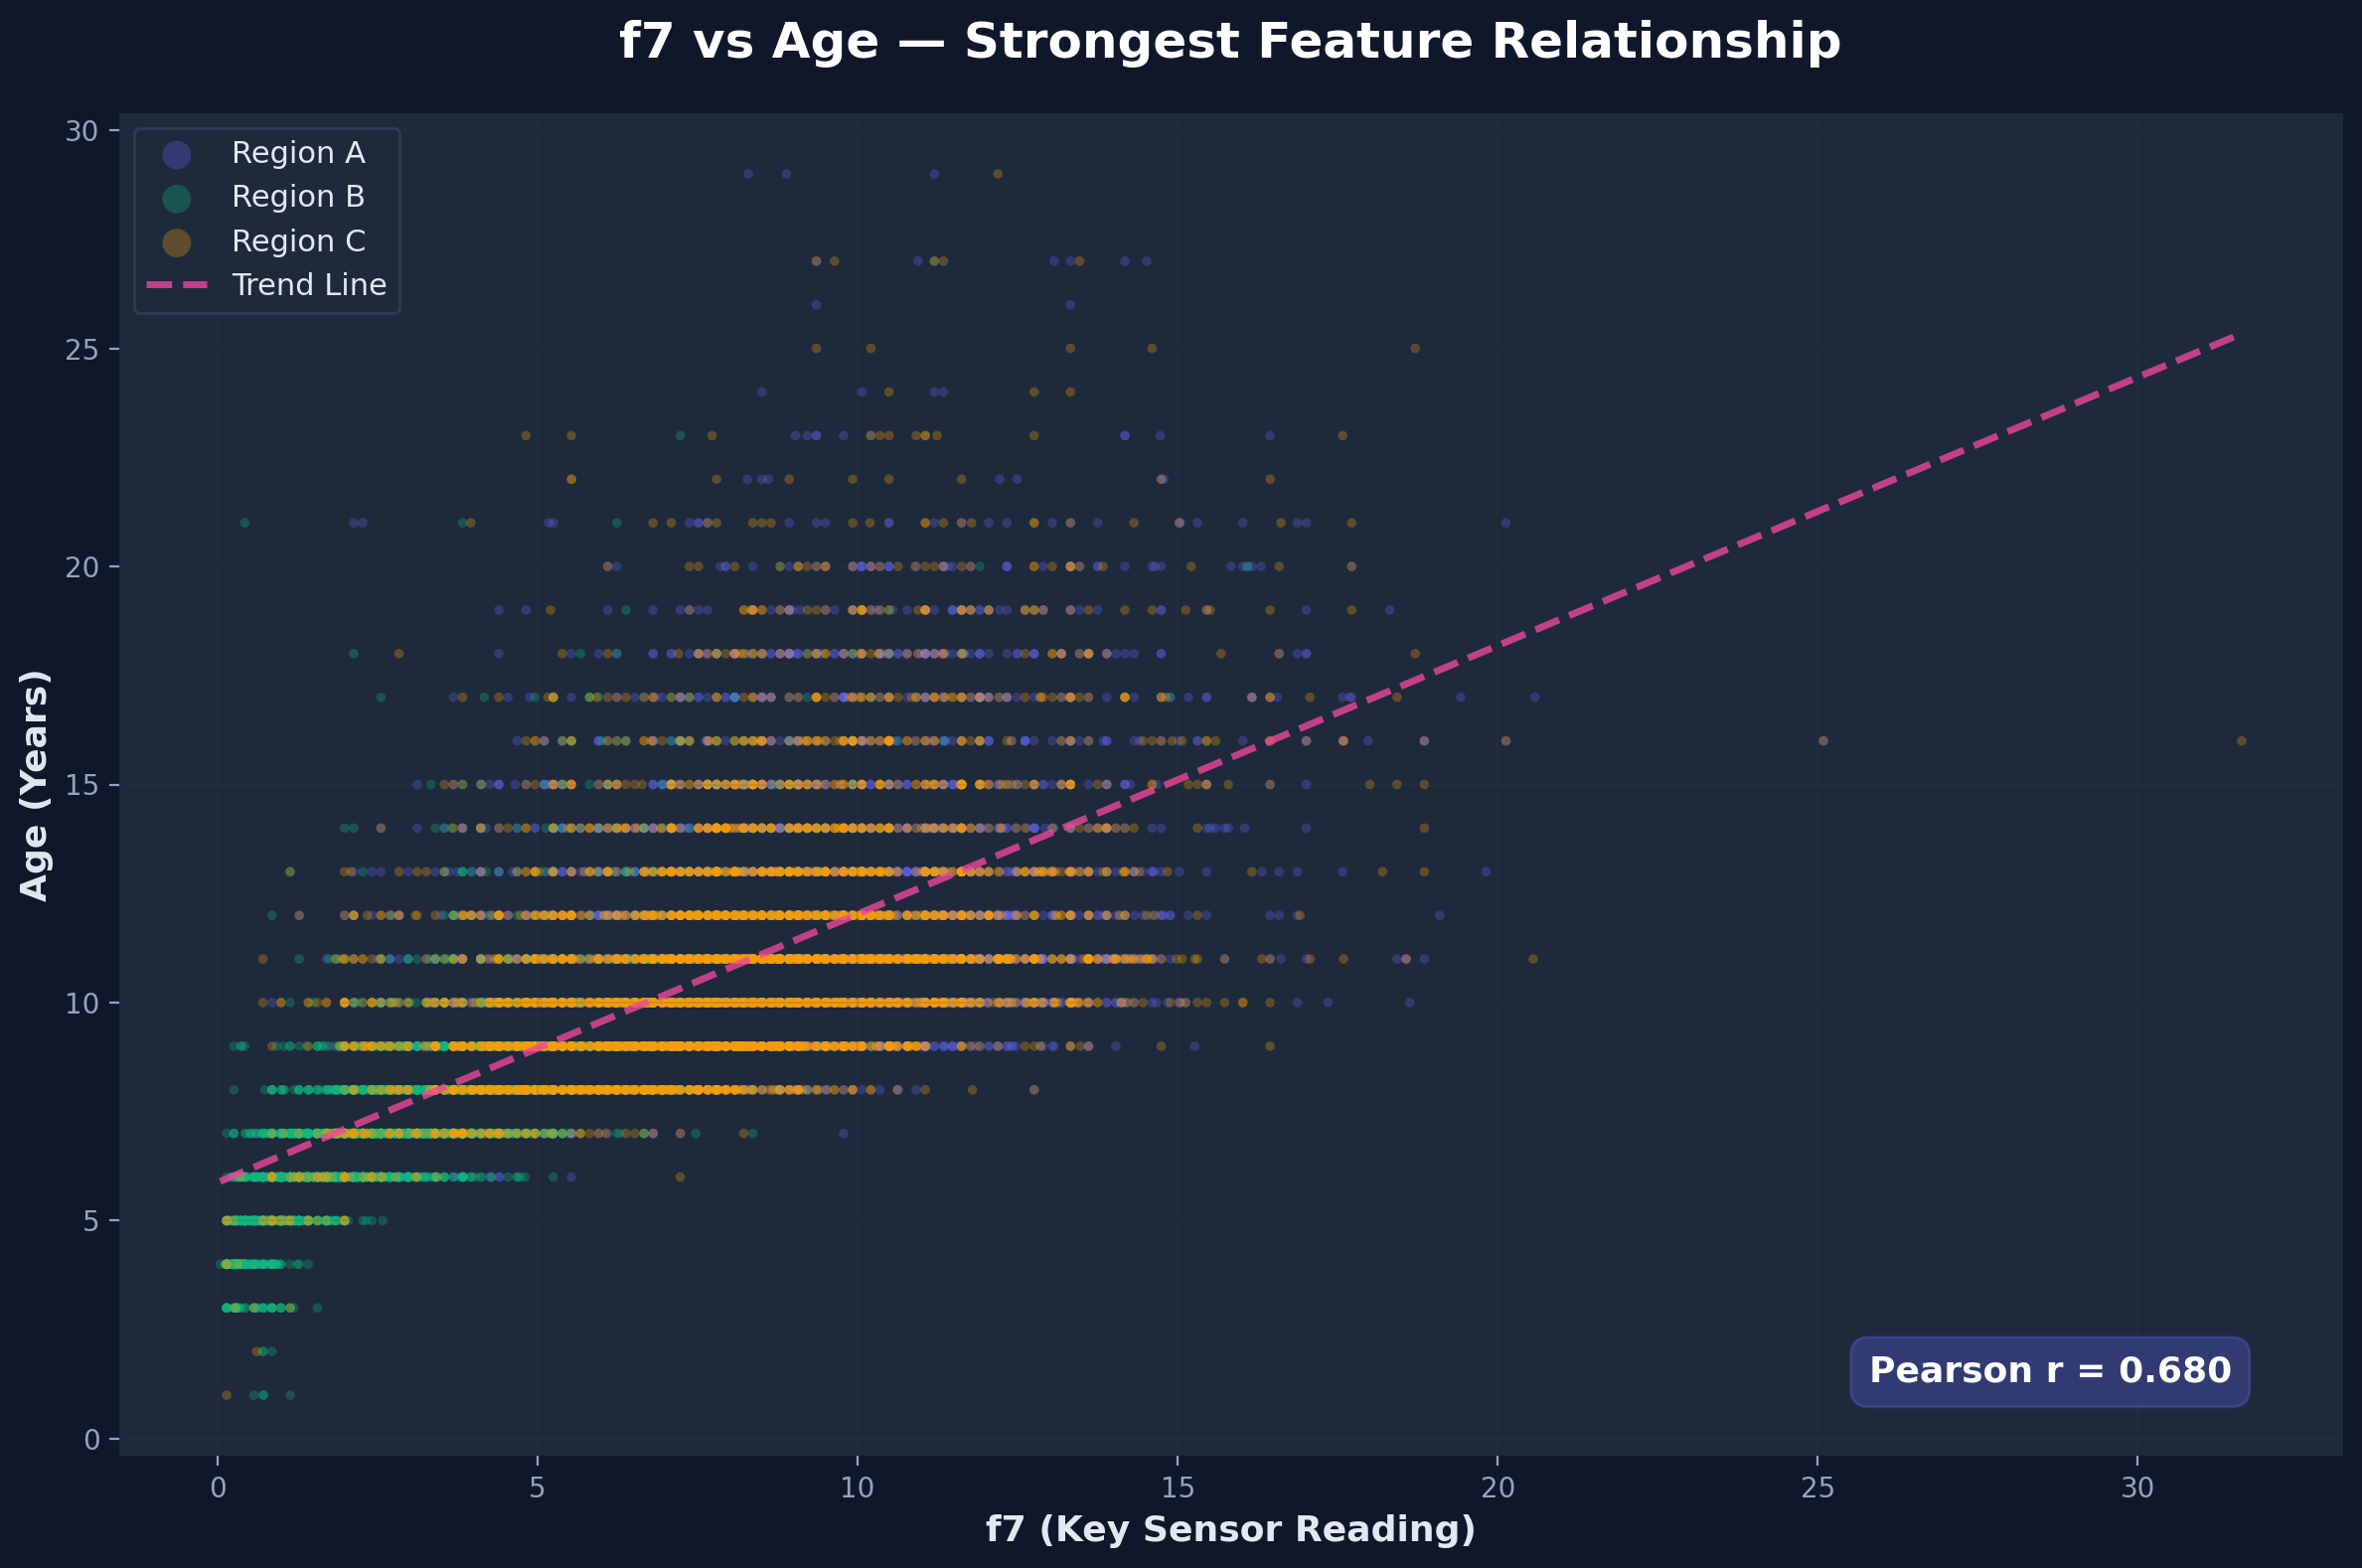
f7 vs Age Scatter Plot
Scatter plot detailing the relationship between the strongest feature (f7) and Age.
Let's discuss
clean energy together.
I'm always open to discussing research collaborations, internship opportunities, or just talking about machine learning and renewable energy optimization. If you're passionate about building a sustainable future, reach out!